 |
|
 |
|
| |
Resources
Magniss is a productivity improvement software solutions provider based out of Singapore.
Magniss solutions have been successfully deployed in multiple customer sites in Singapore and our customers have been able to utilize the PIC schemes successfully over the last year.
|
| |
 3 STEPS TO BOOST PRODUCTIVITY USING I.T. If you are an organization that resells IT systems or consults with businesses, primarily Small & medium companies, and possess specific expertise in an industry / vertical, then you should talk to us.
In particular, if you are an organization reselling branded hardware, provide system integration solutions, resell office productivity software licenses, resell IT Hardware and/or Peripherals, Sell Accounting Software licenses, Provide IT or Management Consulting Services, you fit into our requirement of a potential MVAR.
3 STEPS TO BOOST PRODUCTIVITY USING I.T.
|
|
Step 1. Consolidate / Aggregate data from multiple sources into actionable information
The first step towards improving productivity of your business is to ensure availability of actionable information. But, the challenge lies in getting this information on a regular and timely basis from the underlying operational data. Operational data is most likely being captured using multiple systems like your Accounting software, CRM or sales software, excel sheets, ERP software etc.
|
|
|
Business data that are being captured across various functions or departments of your company and are available in separate systems need to be first consolidated / aggregated into information. This is where IT can help. An IT solution that is capable of combining / aggregating your business data from multiple sources and converting them into actionable information will be of immense help in measuring the productivity level of your organization.
|
|
Step 2. Derive business specific KPIs and monitor/track them through dashboards
|
 |
|
|
Once we have converted the raw data from these multiple sources into information, the next step is use this information and build your business specific KPIs (or Key performance indicators). For e.g in the logistics business, some typical KPIs would be RTK (Revenue Tonne Kilometer) , OTD ( On Time Delivery) or TAT (Turn-around Time). Measuring Productivity through such KPIs have been proven to be most effective method of managing a business.
These KPIs, once calculated, can be visualised in the form of a 'Gauge' or a chart or a graph that immediately provides you with an understanding of where your business stands w.r.t that index.
An IT solution that can intelligently combine all the relevant business information, calculate these KPIs in real-time and provide them to managers through usable and convenient dashboards come in handy while taking both strategic and operational decisions to boosting business productivity.
|
|
Step 3. Get Real time Critical Alerts and ACT on them swiftly !!
What is the use of all these KPIs and dashboards, if you have to login to the IT system everytime to see and comprehend if there are any critical areas that need your attention rightaway !
Here, an IT solution that can provide Critical Alerts based on the movement of certain key indicators or values as and when they happen provides you a "cutting-edge" in decision making. Ability to get critical alerts automatically enables managers to act on them swiftly thereby ensuring that the impact of any negative trend is minimised.
|
Get upto $1.6mn in tax allowances starting YA2013 with PIC
The PIC or Productivity and Innovation Credit was introduced in the Singapore Budget 2010.
The PIC provides significant tax deductions for investments in a broad range of six qualifying activities along the innovation value chain, and it includes purchase of automation equipment including software and training of employees.
Get upto $1.6mn in tax allowances starting YA2013
Did you know that all Singapore companies are eligible for PIC benefits of upto $1.6mn tax deductions or cash payouts upto $60,000 on investments they make onto various productivity improvement measures this year ?
Investments that are eligible for PIC grants include expenses incurred for training of your employees, purchase of business software, purchase of computers, laptops etc.
|
|
400% Tax Deduction/Allowances
For YA 2011 to YA 2015, all businesses can enjoy deduction/allowances at 400% on up to $400,000 of their expenditure per year on each of the six qualifying activities instead of the 100%/150% tax deduction/allowances under the existing tax rules.
To enable businesses to enjoy maximum PIC benefits, the annual expenditure cap of $400,000 for each activity are pooled to give a combined cap for the period YA 2011 and YA 2012 and the period YA 2013 to YA 2015.
Businesses would therefore be able to enjoy a total tax deduction of up to $3.2 million for YAs 2011 and 2012 and up to $4.8 million for YAs 2013 to 2015 as summarised here:
Year of Assessment (YA) |
Expenditure Cap per Qualifying Activity |
Tax Deduction per Qualifying Activity |
2011 and 2012 (Combined) |
$800,000 |
$3,200,000
(400% x $800,000) |
2013 to 2015 (Combined)
|
$1,200,000 |
$4,800,000
(400% x $1,200,000) |
|
|
Cash Payouts upto 60%
To support small and growing businesses to innovate and improve productivity, businesses can exercise an option to convert their expenditure into a non-taxable cash payout.
They can convert up to $100,000 (subject to a minimum of $400) of their total expenditure in all the six qualifying activities into cash payout.
This PIC cash payout option is available from YA 2011 to YA 2015 at a conversion rate of 30% for YA 2011 and YA 2012. The higher cash conversion rate of 60% was announced in Budget 2012 to further support businesses in investing in innovation and productivity.
For YA 2011 and YA 2012, businesses can opt to convert up to a combined cap of $200,000 qualifying expenditure for all six qualifying activities, into cash payout. The total cash payout for YA 2011 and YA 2012 is therefore a maximum of $60,000 ($200,000 x 30%).
For YA 2013 to YA 2015, businesses can receive cash payout up to $60,000 ($100,000 x 60%) each year with the higher conversion rate of 60%.
|
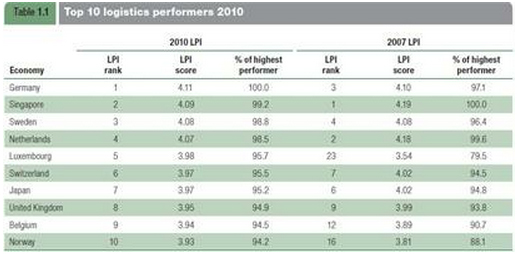
What is your company's LPI ? Did you know that Singapore dropped from 1st place in 2007 to 2nd place in 2010 in the world-wide logisitcs performance index (LPI) ?
The LPI is a comprehensive index created to help countries identify the challenges and opportunities they face in trade logistics performance. The World Bank conducts the LPI survey every two years and releases a comprehensive report.
Logistics Performance Index (LPI)
logisitcs performance index (LPI) ?
See Table 1.1 above that shows the top 10 performers in the world in 2010 compared to 2007.
What is LPI ?
The LPI is a comprehensive index created to help countries identify the challenges and opportunities they face in trade logistics performance. The World Bank conducts the LPI survey every two years and releases a comprehensive report.
For your copy of the World Bank LPI report, reply to this mail now..or click here and enter your details... It's FREE !
Measuring logistics performance using the LPI.
The World Bank’s Logistics Performance Index (LPI) summarizes
the performance of countries in six areas that capture the most
important aspects of the current logistics environment:
Efficiency of the customs clearance process.
Quality of trade and transport-related infrastructure.
Ease of arranging competitively priced shipments.
Competence and quality of logistics services.
Ability to track and trace consignments.
Frequency with which shipments reach the consignee within the scheduled or expected time.
For your copy of the World Bank LPI report, reply to this mail now..or click here and enter your details... It's FREE !
|
| |
|
|
|
| |
|